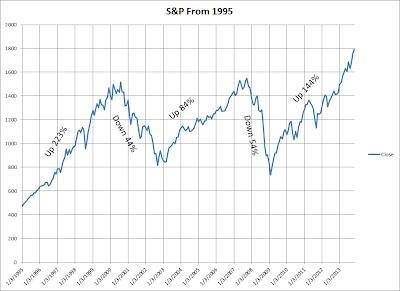
Pretty interesting, don't you think. Look at the duration of the bull markets. The first one went from 1995 to June 2000. So 5 1/2 years. In reality it was longer as it went up steadily, though not steeply from 1990 to 1995 as well. The second one went from March of 2003 (right after the shock and awe in Iran) until September 2007. So a bit more than 4 years. The current one began in March 2009 and is still intact, so a bit more than 4 1/2 years. I am not sure where I am going with this. I guess one point is that if we do hit a bear market, there is likely not a big rush to get back in. But you do not need to time the exact bottom to be ok. Nor to you need to sell at the exact top.
Even if I was pretty sure we were about to get into a bear market, I am not 100% sure what I would do. I suppose the primary options are (1) to go to a larger cash position, (2) try some form of hedging, either shorts or puts or (3) stay invested, but go with the most defensive names.
I'd suggest in the 2007-09 bear market, there were not a lot of safe havens. I seem to recall the 2000-03 bear market being much worse in technology names while some old economy stocks fared okay.
I have created a "Bear Flag Table". I am not really sure if it will work, but here are the factors:
| 50 Day EMA | 200 Day EMA | Difference |
| MDY 50 EMA | MDY 200 EMA | Difference |
| 232.15 | 222.29 | 4.4% |
| SPY 50 EMA | SPY 200 EMA | Difference |
| 173.39 | 167.71 | 3.4% |
| IWV 50 EMA | IWV 200 EMA | Difference |
| 104.10 | 100.21 | 3.9% |
When the difference becomes negative, that will raise a bear flag. My theory is that the smaller stocks will raise the indicator first, that is why I have the MDY and IWV there. I have looked in the past and this approach seems to correlate pretty closely with the table above.
It turned bear in mid 2000. It became bull again in late 2003. It went bear again right at start of 2008. Finally it went bull again late in 2009. So actually pretty good.


No comments:
Post a Comment