 This is a test of the Emergency Broadcast System. Pretty neat test pattern, huh? Not much to broadcast on this sleepy Sunday before (non) Labor Day.
I have spent a little time revamping my stock listing, now that I have sold two stocks. I do know that this whole stock tracking thing will be a lot more fun when I am in the black.
Stock News: Forbes mentioned HW in an article. As you may recall I have trouble getting excited by Forbes' comments. Here is what they said:
Headwaters (nyse: HW - news - people ) (22, HW) sells technology to turn coal waste into usable fuel. The company is controversial for another reason: This synfuel lives on federal subsidies, as this magazine has explained ( FORBES , Jan. 22, 2001). Whatever its merit, I think the tax credit for recovered coal dust is here to stay. The company is also diversifying into building products, chemical waste disposal and--okay, here's another federal subsidy--ethanol. The stock is cheap at 11 times next year's earnings.
Actually, they also like BVF, another MFI stock I have been watching, perhaps it is time to pull the trigger!
Biovail (nyse: BVF - news - people ) (17, BVF) sells cardiovascular, nervous system and pain-management pills with an improved time-release, allowing for fewer pills per day. Why is it trading at only ten times trailing earnings? The stock is tied to court rulings allowing a generic competitor for its biggest single drug, Wellbutrin XL, but the technology has lots of applications and upside.
To be clear, this is in Forbes magazine, but is by Ken Fisher. Hmm, I did a quick Google of Mr Fisher. He is not a fly-by-night guy. Maybe it is time for BVF. They have really been pounded with the allegations that the CEO was buying/selling stock in a "secret" fund and that they may be losing some patent protection. A lot of that is built in the price (it would seem) and any good news (like I have for DLX) could pop the stock... what do you think? You need to answer because, This is a Test!
Here is my new and revised table format. Also let me know what you think! I want to have the best MFI graphics and charts on the web. Have a great day!
| Current Portfolio | |||
| Stock | Cost | Current | Gain |
| UST | $39.36 | $53.23 | 38.1% |
| PCU | $78.13 | $93.10 | 25.2% |
| MGLN | $38.34 | $47.49 | 23.9% |
| TRLG | $17.02 | $20.40 | 19.9% |
| MTEX | $13.11 | $14.96 | 14.7% |
| FTO | $28.76 | $32.83 | 14.3% |
| PNCL | $6.68 | $7.14 | 6.9% |
| ANF | $61.13 | $64.96 | 6.8% |
| RAIL | $58.18 | $60.05 | 3.3% |
| PGI | $7.71 | $7.84 | 1.7% |
| NSS | $45.89 | $46.47 | 1.3% |
| CHKE | $37.55 | $36.76 | 1.1% |
| PTEN | $27.74 | $27.89 | 0.8% |
| TGIS | $10.34 | $10.20 | -0.2% |
| MSTR | $94.36 | $91.61 | -2.9% |
| ELX | $17.85 | $17.20 | -3.6% |
| KG | $17.31 | $16.33 | -5.7% |
| FDG | $34.03 | $30.20 | -8.6% |
| ISNS | $13.17 | $11.78 | -10.5% |
| PACR | $32.53 | $27.46 | -14.7% |
| TBL | $34.50 | $28.43 | -17.6% |
| EZEN | $2.84 | $2.31 | -18.5% |
| ORCT | $11.83 | $8.90 | -24.8% |
| PONR | $32.97 | $23.78 | -27.9% |
| DLX | $26.36 | $17.70 | -30.4% |
| PTSC | $1.31 | $0.82 | -37.4% |
| HW | $37.42 | $22.07 | -41.0% |
| OVTI | $27.79 | $15.39 | -44.6% |
| Current Gain/Loss ($) | -$15,800 | ||
| Current Gain/Loss (%) | -5.4% | ||
| Sold Gain/Loss ($) | $5,436 | ||
| Sold Gain/Loss (%) | 27.1% | ||
| Total Gain/Loss ($) | -$10,365 | ||
| Benchmark Gain/Loss ($) | $5,671 | ||
| Annual IRR | -9.4% | ||
| Total Gain/Loss (%) | -3.6% | ||
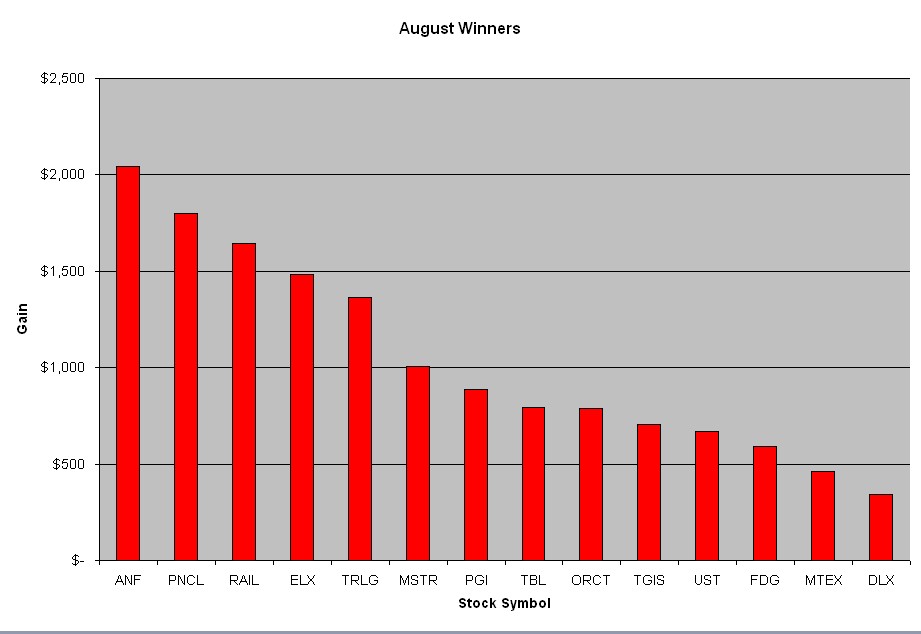
One final thing to expirement with. I have created a graph that shows what stocks did well in the past month. Let us see how it looks:


No comments:
Post a Comment