Saturday, September 30, 2006

Another Week...

Quick update. It was a good week, just a day away (Friday) from being a great week. That concludes the 3rd quarter and over 7 months at MFI. Sad to report, I am still in the red. I did take some of my dividends I have received and re-invested them. Then in the parallel IWV account, I reinvested dividends as well. I bought a little extra HW & PTEN with my dividend $. I have now moved 15 of my 30 stocks to the higher investment amount.

Current Portfolio
Stock Cost Current Gain
UST $39.36 $54.83 43.6%
MTEX $13.11 $17.72 35.8%
PCU $78.13 $92.50 24.5%
TRLG $17.02 $21.11 24.0%
ANF $61.13 $69.48 14.2%
PGI $7.71 $8.68 12.6%
BBSI $19.18 $21.47 11.9%
MGLN $38.34 $42.60 11.1%
PNCL $6.68 $7.41 10.9%
MSTR $94.36 $101.83 7.9%
VPHM $11.80 $12.17 3.1%
ELX $17.85 $18.17 1.8%
TGIS $10.34 $10.27 1.2%
CHKE $37.55 $36.61 0.7%
KG $17.31 $17.03 -1.6%
ISNS $13.17 $12.48 -5.2%
BLDR $16.10 $15.23 -5.4%
FTO $28.76 $26.58 -7.4%
RAIL $58.18 $53.00 -8.9%
PACR $32.53 $27.76 -13.7%
PTEN $27.74 $23.76 -13.8%
TBL $34.50 $28.77 -16.6%
FDG $34.03 $26.53 -17.3%
PONR $32.97 $24.51 -25.7%
ORCT $11.83 $8.74 -26.1%
DLX $26.36 $17.10 -32.7%
PTSCE $1.31 $0.84 -35.9%
HW $37.42 $23.35 -37.6%
EZEN $2.84 $1.75 -38.3%
OVTI $27.79 $14.27 -48.7%


Current Gain/Loss ($) -$16,468
Current Gain/Loss (%) -5.2%
Sold Gain/Loss ($) $9,495
Sold Gain/Loss (%) 31.5%
Total Gain/Loss ($) -$6,973
Benchmark Gain/Loss ($) $10,801
Annual IRR -5.1%
Total Gain/Loss (%) -2.2%

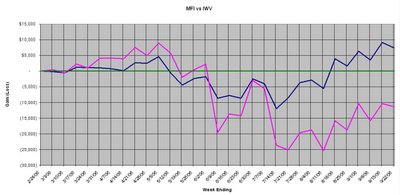
Here is the graph. I am red while blue shows the benchmark

Friday, September 29, 2006

Busy, Busy, Busy

Quick look at what is going on. September is coming to a close. I was down 3.6% at the start of the month. I now am 1.4% away from breakeven. My Side Car MFI stocks that I have been holding for short stretches have done extremely well. If I counted those gains I 'd be well in the black. Of course I won't count them, but it illustrates that there is value in watching and learning the MFI stocks. EZEN has really picked up. Remember I bought a bunch of shares at $1.71 and $1.39 when it tumbled. It is now $1.90. Yesterday I sold my BBSI side car holdings and moved into PTEN (selling under 6x 2007 eps).

Current Portfolio
Stock Cost Current Gain
UST $39.36 $54.09 41.7%
MTEX $13.11 $18.04 38.2%
PCU $78.13 $92.07 23.9%
TRLG $17.02 $20.96 23.1%
ANF $61.13 $71.60 17.7%
BBSI $19.18 $22.00 14.7%
PGI $7.71 $8.78 13.9%
MGLN $38.34 $42.73 11.5%
TGIS $10.34 $11.15 9.7%
PNCL $6.68 $7.29 9.1%
MSTR $94.36 $99.85 5.8%
VPHM $11.80 $12.41 5.2%
CHKE $37.55 $36.72 1.0%
ELX $17.85 $17.88 0.2%
KG $17.31 $16.86 -2.6%
BLDR $16.10 $15.66 -2.7%
ISNS $13.17 $12.75 -3.2%
FTO $28.76 $26.40 -8.1%
RAIL $58.18 $53.01 -8.8%
PACR $32.53 $28.25 -12.2%
PTEN $27.74 $23.73 -13.9%
TBL $34.50 $29.11 -15.6%
FDG $34.03 $26.40 -19.8%
PONR $32.97 $25.13 -23.8%
ORCT $11.83 $8.59 -27.4%
DLX $26.36 $17.50 -31.1%
EZEN $2.84 $1.90 -33.0%
HW $37.42 $24.00 -35.9%
PTSCE $1.31 $0.82 -37.8%
OVTI $27.79 $14.53 -47.7%


Current Gain/Loss ($) -$13,863
Current Gain/Loss (%) -4.3%
Sold Gain/Loss ($) $9,495
Sold Gain/Loss (%) 31.5%
Total Gain/Loss ($) -$4,368
Benchmark Gain/Loss ($) $11,521
Annual IRR -3.3%
Total Gain/Loss (%) -1.4%

Wednesday, September 27, 2006

Number of Stocks

One takeaway from my reading of Phil Town's #1 Rule book was his comments on the number of stocks to own. He argued strongly that by buying more stocks, you are not making your portfolio less risky, but rather you are making it more likely you'll match the indice averages. That made me think. My current portfolio has 42 stocks. 12 in my non MFI account and 30 in MFI. That is probably too many stocks. I like the 12 in non MFI. I really need that many to get me international exposure, banking, utility & insurance... areas not covered by MFI. However, I want to pare the 30 MFI stocks down to 20 in 2007. I believe (though I could be wrong) that if I pick fewer stocks that I can generally get a little better quality stock and be more selective on when I buy. We'll see how it works. I want to get higher quality stocks in 2007 because Jubak keeps scaring me with his outlook for the future.

An added benefit of fewer stocks is that it'll be easier for you to see my list on a single page.

Cramer had what I felt was a useful way of thinking about stocks. He would score his stocks every Friday from "1" to "4". A "1" meant you would like to buy more at the current price. A "2" meant you would buy more if the price dropped a bit. A "3" meant you would like to sell if a decent rally. A "4" meant sell ASAP. Along with each score, you had to write one or two sentences explaining why you owned the stock. Just going through the thought process weekly was very helpful. It was also very interesting to look back 3 or 6 months later and see if you were right on your scoring. Quite often it was exactly opposite. The stocks you scored as a "3" (I rarely used "4") should have been "1"s. That was because of fear. The stock had dropped and you scored it a "3" as you had lost confidence in it. In fact I should have been buying instead of considering selling in a rally. I won't bore you with the sentences, but here is how I would rank my stocks right now:

"1" Stocks
ELX 18.11
HW 24.33
PTEN 23.66
PNCL 7.14
PONR 25.09
FTO 26.08
KG 16.29
EZEN.OB 1.60
BLDR 15.95

"2" Stocks
MGLN 42.61
MSTR 99.07
TBL 28.90
PACR 27.88 2
DLX 17.64 2
PGI 8.83 2
TGIS 11.15 2
CHKE 36.32 2
RAIL 55.00 2
FDG 27.41 2
ORCT 8.76 2
PTSCE.OB .87 2
ISNS 12.14 2
BBSI 21.24 2
VPHM 12.47 2

"3" Stocks
UST 53.49 3
ANF 71.57 3
PCU 90.88 3
MTEX 17.21 3
OVTI 14.28 3
TRLG 20.84 3

Monday, September 25, 2006

Am I Negative? Am I Disillusioned?

Commentary in Yahoo Groups about people being disillusioned. I don't believe I am disillusioned. Disappointed... perhaps. I did not expect to be trailing the benchmark by 5% after over 6 months. Doesn't mean I do not trust the approach. Doesn't mean I am tossing in the towel. JG said it would not be easy.

Ok, now that I have cleared the air... today was a most-excellent day. Up over 1.25%. Things are looking up!

Saturday, September 23, 2006

Laundry Day

Quick posting showing where everything stands. First a quick glance at my monthly test portfolios against the IWV. It isn't very pretty.

Month MFI Benchmark
February 2.62% 3.11%
April -3.80% 1.53%
May -0.99% 2.06%
June 0.08% 3.58%
July 3.25% 3.23%
August 3.50% 3.19%
September -1.90% 0.75%
My Portfolio -3.60% 2.30%

Now my listing of my current portfolio. After looking at this, my conclusion is that I need some more of my stocks to be bought on Merger Monday!

Current Portfolio
Stock Cost Current Gain
UST $39.36 $54.36 42.4%
MTEX $13.11 $16.99 30.2%
TRLG $17.02 $22.08 29.7%
PCU $78.13 $86.92 17.3%
ANF $61.13 $68.44 12.5%
PGI $7.71 $8.54 10.8%
MGLN $38.34 $42.28 10.3%
BBSI $19.18 $21.12 10.1%
PNCL $6.68 $7.26 8.7%
VPHM $11.80 $12.42 5.3%
TGIS $10.34 $10.75 5.1%
MSTR $94.36 $96.11 1.9%
ELX $17.85 $17.80 -0.3%
CHKE $37.55 $35.97 -1.0%
BLDR $16.10 $15.59 -3.2%
KG $17.31 $16.41 -5.2%
RAIL $58.18 $53.84 -7.4%
ISNS $13.17 $12.11 -8.0%
FTO $28.76 $25.74 -10.4%
PACR $32.53 $26.81 -16.7%
TBL $34.50 $28.72 -16.8%
PTEN $27.74 $22.22 -19.3%
FDG $34.03 $26.15 -20.5%
PONR $32.97 $24.93 -24.4%
ORCT $11.83 $8.83 -25.4%
DLX $26.36 $17.62 -30.7%
HW $37.42 $24.01 -35.8%
PTSCE $1.31 $0.79 -39.7%
EZEN $2.84 $1.60 -43.6%
OVTI $27.79 $13.88 -50.1%


Current Gain/Loss ($) -$20,820
Current Gain/Loss (%) -6.5%
Sold Gain/Loss ($) $9,495
Sold Gain/Loss (%) 31.5%
Total Gain/Loss ($) -$11,325
Benchmark Gain/Loss ($) $7,411
Annual IRR -9.0%
Total Gain/Loss (%) -3.6%

Friday, September 22, 2006

Weekly Update

Another week in the books. A few quick comments about my MFI stocks. FDG gave some production guidance on Thursday and announced an 80 cent dividend (Fording announces 2006 third quarter cash distribution and updates guidance). To be honest, I felt their comments were uninspiring as is the norm for FDG. But they went up 2.4% today. I think their pricing must've been stronger than expected.

EZEN was up 6.7%, I knew they had fallen too fast and too far. But even these bright spots (along with a solid gain from TGIS) were not enough as my portfolio continued to flounder. I have changed my weekly chart. It now shows simply net gain/loss. Guess which line is my MFI portfolio?


Thursday, September 21, 2006

Home on the Range

Cramer Flip-Flops

Cramer has done it again. On Friday he said the home stocks had bottomed (Jim Cramer's Stop Trading! House-Proud) and it was safe to buy them again. Then yesterday he says not to buy home builders until the Fed starts lowering rates (Notice Wells). Is it just me, or does he say different things each day? Either way, I am in with both feet with my purchase of BLDR. I have a 52 week horizon so don't need my stock to go up tomorrow (note, BLDR is down 5% for me since JC flashed the "buy" sign).

Warren Buffett

One reason to feel good about buying BLDR is it means I am aligned (somewhat) with Warren Buffett. He is buying USG, which also supplies many products that go into homebuilding. Homes will continue to be built, unless we go into a recession. They will just be a bit cheaper to buy and homebuilders will make less profit per home.

Headwaters and MFI

I think I finally understand why HW has gone up as oil prices declined. I read where federal subsidies of the synfuels kicks in when oil is under $69. So companies buying from HW (like TECO) want their purchases to be subsidized by Uncle Sam. If so, that bodes well for HW... I saw where Jubak increased his price target to $36 based upon the drop in oil prices. That would be terrific for a stock I had basically given up on. Once again it proves the strength of MFI. By making you hold the stocks for a year, you avoid making emotional decisions where you "hate" a stock for a stretch.

The Bigger They Come...

Small vs Large. It is interesting, even with 2 of my worst 3 stocks being small caps (PTSC(E) and EZEN), my small caps are out-performing.
small caps are +2.8%
LARGE CAPS are -5.5%.
That is a big differential.

More PTSC

PTSC(E) wrote a letter to shareholders today (Patriot Scientific Announces CEO Letter to Shareholders). Nothing really new in it. They did state that they expect earnings to be out on Oct 13th (hope that isn't a Friday). They continued to suggest that they are gathering a slew of cash and trying to decide what to do with the $$$.

Wednesday, September 20, 2006

Bad Boys

I was looking at my stocks this morning. I have three stocks that have essentially dropped 50% since my purchase. PTSC(E), EZEN & OVTI. Clearly, these bad boys are driving my negative results as I'd be in the green on my other 27 stocks without them. All three stocks were purchased in the past four months. It made me wonder, "what are the odds of a stock dropping by 50% in 4 months or less?" To have 10% of your holdings do that seems quite extreme.

To answer the question, I took today's top 1000 stocks from the Greenblatt Scan (MF style rankings based off Yahoo Finance ). Then I looked to see how much their price has changed from May 1st to Sep 19th and from June 1st to Sep 19th. Here is what I found :
Out of the 1000 stocks, 45 have dropped by 47% or more since May 1st. 28 Stocks have dropped by 47% or more since June 1st.

So I suppose the answer is that is does happen, but 10% is unlucky. It is more likely to happen with smaller stocks, of 384 stocks with MktCap < $1b, 21 have dropped 47% or more since May. So for the entire universe, 4.5% dropped 47% or more, but for the <1b>
Cramer talked in-depth about ANF last night (Cramer's 'Mad Money' Recap: Digging Into Bottoms). I suppose he was excited because he had flashed the buy sign at $55 and ANF is now north of $68. He stated that he thinks ANF can go to $88. I am sure it is standard Cramer hype, but that would certainly help the home team.

Hmmm, perhaps I was a bit hasty cursing my 3 stocks that are down so much. PTSC(E) spiked up today (+11.7%). Ironically, I had meant to buy some at the end of the day yesterday, but didn't have time. So last night I put in a buy order. It was partially filled, but less partially than I would have liked.

Not to digress, but a non-MFI stock I have been watching with interest is DVN. They were part of the trio announcing the major Gulf oil find 2+ weeks ago. Since that announcement, their price has slid 5% even though the announcement increased their proven reserves by 43%. Gotta love the rational short term mentality of the street.

Good day for the MFI team. I was up 1.2%, while IWV was up a scant 0.67%. Take that! Of course I am still trailing them by 6%.

Current Portfolio
Stock Cost Current Gain
UST $39.36 $54.10 41.8%
MTEX $13.11 $17.37 33.1%
TRLG $17.02 $22.32 31.1%
PCU $78.13 $87.31 17.8%
ANF $61.13 $71.03 16.8%
PNCL $6.68 $7.59 13.6%
PGI $7.71 $8.76 13.6%
MGLN $38.34 $43.40 13.2%
BBSI $19.18 $20.97 9.3%
VPHM $11.80 $12.50 5.9%
MSTR $94.36 $98.67 4.6%
ELX $17.85 $18.40 3.1%
CHKE $37.55 $37.17 2.2%
TGIS $10.34 $10.30 0.8%
BLDR $16.10 $15.80 -1.9%
KG $17.31 $16.26 -6.1%
ISNS $13.17 $12.09 -8.2%
RAIL $58.18 $53.34 -8.3%
FTO $28.76 $25.67 -10.6%
PACR $32.53 $28.41 -11.7%
TBL $34.50 $29.33 -15.0%
PONR $32.97 $26.82 -18.7%
PTEN $27.74 $21.93 -20.4%
ORCT $11.83 $9.00 -23.9%
FDG $34.03 $24.90 -24.2%
DLX $26.36 $18.11 -28.8%
HW $37.42 $24.11 -35.6%
PTSCE $1.31 $0.77 -41.6%
OVTI $27.79 $14.51 -47.8%
EZEN $2.84 $1.41 -50.3%


Current Gain/Loss ($) -$18,276
Current Gain/Loss (%) -5.7%
Sold Gain/Loss ($) $9,495
Sold Gain/Loss (%) 31.5%
Total Gain/Loss ($) -$8,782
Benchmark Gain/Loss ($) $10,123
Annual IRR -7.0%
Total Gain/Loss (%) -2.8%

Tuesday, September 19, 2006

What Goes Up...

Short and sweet (actually not so sweet) tonight. Gave back half my gains from last week today.
  1. Coal companies are getting crushed to fine grey ash.
  2. Jim Jubak (and others) are very negative about 2007.
  3. I was right about airlines, PNCL was up 6% and now is +12%.
  4. My OB stocks have been a disaster zone, both EZEN and PTSC(E) are down about 50%.
  5. The sun will come up tomorrow.

Monday, September 18, 2006

MFI Not Working

Cyperspace (YG) - It is official. MFI is not working in 2006. A poster in Yahoo Groups has run a test where he stratified the market into deciles (Update on MFI Results for Russell 3000 in 2006) . This should come as no surprise to readers of this blog as my monthly benchmark portfolios are almost all behind the benchmark.

What to do? Nothing.

I was reading some research reports over the weekend.

Refiners Tanking

AG Edwards had some good stuff on refiners, Explains why FTO has dropped 30%. (in part at least). Here is what it says:

"US refining margins dropped sharply for the 5th consecutive week., most notably in the East and Gulf coasts. The composite margin averaged $5.10 versus $8.58 the prior week, down from its year-to-date high of $21.96 in April. For 3Q06 margins are averaging $14.67, below $18.52 in 2Q06 and $16.25 a year ago."

They go on to say that this tempers their ST outlook on refiners. Based on this, I will likely sell my double down FTO purchase today.

Five Stars (*****)

S&P publishes a regular listing of Five Star stocks. Based on value and quality. It has generally pefromed pretty well. I thought I'd see if any MFI stocks were on the list.

ANF since 9/20/05 at $45.96 based on valuation
ELX since 4/6/06 at $17.02 based on continued build out of network storage.
FTD (a stock I chose not to buy) since 4/11/06 at $9.84.

PTSC(E)

PTSC picked up the letter E over the weekend. Never a good signE. I have also noted that PTSCE is no longer ever listed on the MFI lists. Not sure why, as nothing has changed except the stock has gotten cheaper. PTSCE did have an encouraging news release over the weekend.

"We reiterate that the decision by the Company to account for its interest in
Phoenix Digital Solutions, LLC in accordance with the equity method of
accounting for investments and its decision to bifurcate the embedded
derivatives in its previously outstanding convertible debentures will not have a
material effect on the Company's financial condition."
So that is promising.

Can We Fix It? Yes We Can!

I added my 30th MFI stock today. BLDR at $16.10. Cramer has been saying the housing stocks have hit bottom (Stocks as Tea Leaves). If so, BLDR will be a smart move. I am still stinging a bit in moving a day too late to buy ASEI, which rose another 5% today. But you can go crazy playing "what if".

Wish me luck.

Sunday, September 17, 2006

Building Consensus

Good morning everyone! I am still wrestling with my next stock purchase. I do have an order out on ASEI, so if Monday is a bad day in the stock market, it could be stock #30. What caught my eye on ASEI last week (Thursday) was that they had signed some new contracts with the Govt. The stock is trading (unfairly I believe) at about 16% below their 200 day EMA. Here is an article on new recent contracts (Big Contracts in the Pipeline for ASEI ).

The second stock which caught my eye over the weekend was BLDR. It is a Dallas company (I have a few of those with TGIS & MTEX) that sells supplies to the homebuilding industry. I know homebuilding has been in a steep decline, but that seems (to me) to be built in the price. BLDR is selling at under 6x next year's earnings. Cramer has become bullish on housing (Cramer's 'Mad Money' Recap: You Can Go Home Again). I don't listen to Cramer and his speculative plays, but I do believe he is pretty good at calling longer term trends.

I like both of these stocks. It is possible that I will buy both of them.

Below I list where my current stocks stand and a 50/500 list:

Current Portfolio
Stock Cost Current Gain
UST $39.36 $53.99 41.5%
TRLG $17.02 $22.14 30.1%
MTEX $13.11 $16.65 27.6%
PCU $78.13 $89.50 20.6%
BBSI $19.18 $21.95 14.4%
PGI $7.71 $8.67 12.4%
ANF $61.13 $68.00 11.8%
MGLN $38.34 $41.97 9.5%
VPHM $11.80 $12.55 6.4%
PNCL $6.68 $7.01 4.9%
MSTR $94.36 $95.89 1.6%
ELX $17.85 $17.75 -0.6%
CHKE $37.55 $36.12 -0.6%
TGIS $10.34 $9.83 -3.8%
KG $17.31 $16.44 -5.0%
ISNS $13.17 $12.50 -5.1%
RAIL $58.18 $52.49 -9.7%
FTO $28.76 $25.88 -9.9%
PACR $32.53 $27.70 -13.9%
TBL $34.50 $28.95 -16.1%
PTEN $27.74 $23.08 -16.2%
FDG $34.03 $26.90 -18.3%
PONR $32.97 $26.27 -20.3%
ORCT $11.83 $9.13 -22.8%
DLX $26.36 $17.53 -31.0%
HW $37.42 $23.37 -37.5%
PTSC $1.31 $0.79 -40.1%
EZEN $2.84 $1.60 -43.6%
OVTI $27.79 $15.10 -45.7%


Current Gain/Loss ($) -$19,278
Current Gain/Loss (%) -6.3%
Sold Gain/Loss ($) $9,495
Sold Gain/Loss (%) 31.5%
Total Gain/Loss ($) -$9,783
Benchmark Gain/Loss ($) $8,824
Annual IRR -8.0%
Total Gain/Loss (%) -3.2%

Top 50 companies with a minimum market cap. of $500 million
Companies are listed in alphabetical order
Name (in alphabetical order) Ticker Market Cap
($ Millions)
Pre Tax
Earnings Yield
Pre Tax
Return on Capital
Price
From
Most Recent
Quarter Data
Alon USA Energy Inc ALJ 1,294.19 17% 75 - 100% 09/15 06/30
Aspreva Pharmaceuticals Corp ASPV 874.34 15% > 100% 09/15 06/30
Axcan Pharma Inc AXCA 621.69 11% > 100% 09/15 06/30
BISYS Group Inc. (The) BSG 1,357.22 9% > 100% 09/15 03/31
Biovail Corp BVF 2,363.23 20% > 100% 09/15 06/30
Block (H&R) Inc. HRB 6,994.28 10% > 100% 09/15 07/31
Builders FirstSource Inc BLDR 561.90 21% 50 - 75% 09/15 06/30
CGI Group Inc. GIB 2,129.72 11% > 100% 09/15 06/30
Career Education Corp CECO 1,943.16 19% 75 - 100% 09/15 06/30
Claire's Stores Inc. CLE 2,666.40 10% 75 - 100% 09/15 07/31
Delek US Holdings Inc DK 903.81 22% 50 - 75% 09/15 06/30
Deluxe Corp DLX 901.30 12% > 100% 09/15 06/30
EarthLink Inc ELNK 981.02 14% > 100% 09/15 06/30
EuroZinc Mining Corp EZM 1,388.38 23% 75 - 100% 09/15 06/30
Fording Canadian Coal Trust FDG 3,954.30 20% > 100% 09/15 06/30
Freeport-McMoran Copper & Gold Inc. FCX 9,751.04 22% 50 - 75% 09/15 06/30
FreightCar America Inc RAIL 662.79 27% > 100% 09/15 06/30
Frontier Oil Corp. FTO 2,901.33 22% > 100% 09/15 06/30
Harland (John H.) Co JH 978.53 11% > 100% 09/15 06/30
Headwaters Inc HW 980.56 14% 50 - 75% 09/15 06/30
Heidrick & Struggles International Inc HSII 624.80 10% > 100% 09/15 06/30
Herbalife Ltd HLF 2,274.72 10% > 100% 09/15 06/30
Holly Corp HOC 2,279.35 16% 75 - 100% 09/15 06/30
K-Swiss Inc KSWS 1,001.52 13% 75 - 100% 09/15 06/30
Kinetic Concepts Inc KCI 2,215.59 13% 75 - 100% 09/15 06/30
King Pharmaceuticals Inc. KG 3,996.42 18% > 100% 09/15 06/30
Korn/Ferry International KFY 873.61 11% > 100% 09/15 07/31
Labor Ready Inc. LRW 885.63 14% > 100% 09/15 06/30
Lam Research Corp LRCX 5,331.48 9% > 100% 09/15 06/30
MTS Systems Corp MTSC 581.50 11% 75 - 100% 09/15 06/30
McClatchy Co (The) MNI 1,839.37 13% 50 - 75% 09/15 06/30
Middleby Corp (The) MIDD 604.58 9% > 100% 09/15 06/30
NS Group Inc. NSS 1,459.73 14% 75 - 100% 09/15 06/30
Net 1 Ueps Technologies Inc UEPS 1,177.38 9% > 100% 09/15 06/30
Nucor Corp NUE 14,417.00 17% 50 - 75% 09/15 06/30
Odyssey Healthcare Inc ODSY 539.49 9% > 100% 09/15 06/30
OmniVision Technologies Inc OVTI 822.92 24% > 100% 09/15 07/31
Pacer International Inc PACR 1,045.59 10% > 100% 09/15 06/30
Palm Inc PALM 1,528.24 12% > 100% 09/15 05/31
Patterson-UTI Energy Inc PTEN 3,832.55 24% 50 - 75% 09/15 06/30
Prestige Brands Holdings Inc PBH 568.89 9% > 100% 09/15 06/30
Southern Copper Corp PCU 13,177.08 18% 50 - 75% 09/15 06/30
Teck Cominco Ltd TCK 12,859.87 21% 50 - 75% 09/15 06/30
Thor Industries Inc. THO 2,347.85 12% 75 - 100% 09/15 04/30
United Online Inc UNTD 782.56 12% > 100% 09/15 06/30
Valassis Communications Inc. VCI 860.35 14% > 100% 09/15 06/30
ViroPharma Inc VPHM 860.89 13% > 100% 09/15 06/30
Western Digital Corp WDC 3,540.63 13% 50 - 75% 09/15 06/30
Western Refining Inc WNR 1,414.51 22% > 100% 09/15 06/30
Westwood One Inc. WON 626.69 11% > 100% 09/15 06/30