I am just finishing "The World is Flat". And while the US economy may dip a bit, anyone who thinks the world economy will go backwards is crazy. Listen to this statistic: Beijing is adding 30,000 new cars to the roads every month! Here is another one: 16 of the 20 most populated cities in the world are in China. Their energy consumption is up 65% from 2002 to 2005. We have not seen anything yet.
When I read statistics like those, I think if you buy a stock in anything that China needs you have a built-in floor. That is why I hold TCK, TGB and NXG. I really need to add a steel producer as well. The appetite for stell as infrastructures are built in India and China will be insatiable.
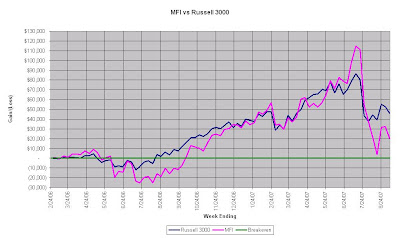
Here is my weekly graph:
 Then here are my holdings and how I am doing. I did sell my VPHM on Friday. I did not re-invest it all yet, but I did add to my GVHR position a bit as I did not quite buy a full amount of it in March.
| Current Portfolio | ||||
| Stock | Purchase Date | Cost | Current | Gain |
| TGB | 4/16/2007 | $2.64 | $4.41 | 67.0% |
| ASEI | 10/5/2006 | $45.85 | $66.63 | 45.8% |
| FDG | 3/8/2007 | $25.45 | $34.01 | 36.0% |
| FTO | 1/10/2007 | $35.16 | $40.50 | 15.3% |
| TCK | 8/16/2007 | $36.50 | $40.65 | 11.4% |
| KSW | 5/10/2007 | $6.48 | $7.20 | 11.2% |
| LRCX | 7/3/2007 | $47.51 | $52.11 | 9.7% |
| VALU | 5/29/2007 | $44.01 | $46.90 | 7.2% |
| DGX | 3/17/2007 | $52.11 | $54.67 | 5.3% |
| CHKE | 7/17/2007 | $36.70 | $36.84 | 2.4% |
| THO | 3/26/2007 | $40.30 | $41.04 | 2.0% |
| NXG | 12/20/2006 | $3.04 | $3.08 | 1.3% |
| VSNT | 7/27/2007 | $19.52 | $19.61 | 0.5% |
| UNTD | 5/1/2007 | $14.51 | $14.04 | -0.9% |
| JTX | 4/9/2007 | $28.70 | $28.00 | -2.0% |
| RAIL | 2/16/2007 | $45.54 | $44.43 | -2.2% |
| WNR | 7/27/2007 | $53.64 | $51.62 | -3.8% |
| WSTG | 5/15/2007 | $14.98 | $14.11 | -4.1% |
| KSWS | 7/27/2007 | $23.94 | $22.87 | -4.5% |
| TGIS | 11/30/2006 | $9.18 | $8.65 | -4.7% |
| HGG | 8/3/2007 | $13.48 | $12.80 | -5.0% |
| BBSI | 9/7/2007 | $24.13 | $22.52 | -6.7% |
| PNCL | 2/9/2007 | $17.07 | $15.18 | -11.1% |
| CHCG.OB | 6/5/2007 | $5.93 | $5.16 | -12.9% |
| UG | 6/13/2007 | $12.09 | $10.19 | -15.7% |
| AEO | 7/10/2007 | $28.42 | $23.82 | -15.8% |
| PACR | 1/3/2007 | $25.46 | $21.12 | -16.3% |
| NOOF | 4/27/2007 | $8.59 | $6.79 | -19.5% |
| USHS | 6/25/2007 | $11.22 | $7.92 | -29.4% |
| GVHR | 9/12/2007 | $15.91 | $10.86 | -31.1% |
| IVAC | 11/23/2006 | $23.52 | $15.58 | -33.8% |
| EGY | 12/13/2006 | $6.42 | $3.72 | -42.1% |
| Gain/Loss Open Positions ($): | ($15,694) | |||
| Gain/Loss Open Positions (%): | -2.7% | |||
| Gain/Loss Closed Positions ($): | $35,911 | |||
| Gain/Loss Closed Positions (%): | 7.0% | |||
| Total Gain/Loss ($): | $20,217 | |||
| Benchmark Gain/Loss ($): | $45,793 | |||
| Annual IRR: | 3.9% | |||
| Total Gain/Loss (%): | 3.5% | |||


No comments:
Post a Comment