All together now:
There's no business like "shoo" business If you tell me it's so Traveling through the country is so thrilling Standing out in front on opening nights Smiling as you watch the benches filling And see your billing up there in lights
Who out there knows where that song is from? Hint, I can hear Ethel Merman singing it.
Sadly, my newest stock didn't exactly get off to a roaring start. I bought SHOO when it was down 7% (32.35), but it proceded to drop further.
 Oh well, I do plan to be in this for a year. Not much to talk about regarding my portfolio today. Up a very average 0.44%.
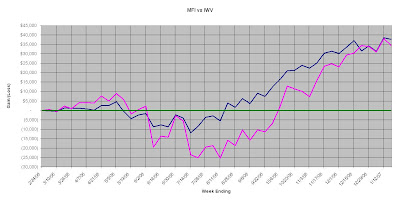
Here is how my portfolio stands, down about 1% to the benchmark.
| Current Portfolio | ||||
| Stock | Purchase Date | Cost | Current | Gain |
| PNCL | 05/04/06 | $6.68 | $17.65 | 164.2% |
| UST | 02/24/06 | $39.36 | $56.00 | 48.0% |
| TGIS | 05/01/06 | $10.34 | $14.34 | 41.1% |
| ANF | 03/02/06 | $61.13 | $79.90 | 31.6% |
| MSTR | 02/24/06 | $94.36 | $121.86 | 29.1% |
| VPHM | 09/11/06 | $11.79 | $15.00 | 27.2% |
| ASEI | 10/05/06 | $45.85 | $56.26 | 22.7% |
| CHKE | 05/16/06 | $37.55 | $43.28 | 20.4% |
| PGI | 04/07/06 | $7.71 | $9.13 | 18.4% |
| MTEX | 05/22/06 | $13.11 | $15.13 | 17.2% |
| BBSI | 09/06/06 | $19.56 | $22.72 | 16.5% |
| DLX | 04/03/06 | $26.41 | $27.98 | 9.4% |
| BLDR | 09/18/06 | $15.91 | $17.34 | 9.0% |
| ISNS | 07/07/06 | $13.17 | $14.31 | 8.6% |
| MGLN | 02/24/06 | $38.34 | $40.55 | 5.8% |
| ELX | 02/24/06 | $17.85 | $18.50 | 3.6% |
| TRLG | 06/13/06 | $17.02 | $17.38 | 2.1% |
| KG | 05/31/06 | $17.31 | $17.50 | 1.1% |
| PONR | 05/09/06 | $30.48 | $29.55 | -3.1% |
| SHOO | 01/17/07 | $32.36 | $30.94 | -4.4% |
| FTO | 05/15/06 | $28.76 | $27.12 | -5.3% |
| PACR | 03/17/06 | $32.53 | $29.30 | -8.1% |
| RAIL | 05/26/06 | $58.18 | $52.93 | -8.9% |
| PTEN | 02/27/06 | $26.72 | $23.61 | -11.0% |
| TBL | 03/15/06 | $34.50 | $29.64 | -14.1% |
| ORCT | 06/02/06 | $11.83 | $9.83 | -16.9% |
| EZEN.OB | 06/19/06 | $2.84 | $2.12 | -25.2% |
| FDG | 05/31/06 | $34.03 | $21.54 | -29.6% |
| HW | 02/24/06 | $33.04 | $23.21 | -29.8% |
| Gain/Loss Open Positions ($): | $24,965 | |||
| Gain/Loss Open Positions (%): | 7.5% | |||
| Gain/Loss Closed Positions ($): | $9,435 | |||
| Gain/Loss Closed Positions (%): | 18.2% | |||
| Total Gain/Loss ($): | $34,400 | |||
| Benchmark Gain/Loss ($): | $37,550 | |||
| Annual IRR: | 15.5% | |||
| Total Gain/Loss (%): | 10.4% | |||


No comments:
Post a Comment