 The Rime of the Ancient Mariner
I was up for the week, but I trailed the MFI Index and the Russell 3000. My six remaining RTO stocks are my Albatross. I did sell SCEI yesterday. I am sure that will turn out to be the wrong decision, but I am certainly becoming gun shy post CCME. SCEI was negatively profiled in this article (Sino Clean Energy (SCEI) Investigatory Report - Overstated Revenues?). Oh well. I will try not to look back.
So for the year, my MFI portfolio is down 0.8% versus the MFI Index being up 8% and the Russell 3000 being up 9%. Just so you don't feel too sorry for me, my overall portfolio is up 7.4%, so I am doing pretty well x-MFI.
Current Holdings
Here are my current holdings and how each stock is doing versus Russell benchmark:
| Symbol | Initial | Current | Pct Gain | IWV Initial | IWV Change |
| AGX | $8.45 | $9.40 | 11.2% | $77.82 | 5.0% |
| ARO | $24.53 | $25.53 | 4.1% | $76.90 | 6.3% |
| AZN | $47.27 | $49.83 | 9.3% | $75.92 | 7.6% |
| CEL | $26.22 | $32.10 | 33.1% | $63.45 | 28.8% |
| CHKE | $18.18 | $19.40 | 13.1% | $63.68 | 28.3% |
| CMFO | $5.08 | $3.47 | -31.7% | $65.01 | 25.7% |
| CMTL | $26.63 | $28.30 | 8.5% | $70.38 | 16.1% |
| CSCO | $16.97 | $17.52 | 3.2% | $79.97 | 2.2% |
| DELL | $14.75 | $15.47 | 4.9% | $80.04 | 2.1% |
| EESC | $2.20 | $1.70 | -22.7% | $67.97 | 20.2% |
| IDCC | $47.49 | $46.29 | -2.3% | $77.54 | 5.4% |
| INTC | $19.02 | $23.15 | 22.5% | $67.43 | 21.2% |
| JGBO | $6.82 | $4.74 | -30.5% | $71.80 | 13.8% |
| MNDO | $2.72 | $3.46 | 39.0% | $77.86 | 5.0% |
| MRX | $28.14 | $35.46 | 26.0% | $79.13 | 3.3% |
| MSFT | $27.26 | $25.92 | -4.3% | $73.88 | 10.6% |
| NEP | $5.67 | $4.27 | -24.7% | $73.87 | 10.6% |
| NEWN | $6.31 | $3.67 | -41.8% | $71.54 | 14.2% |
| PM | $44.30 | $69.44 | 62.2% | $64.43 | 26.8% |
| PWER | $8.53 | $8.25 | -3.3% | $77.60 | 5.3% |
| RAI | $32.14 | $37.11 | 17.0% | $76.11 | 7.4% |
| SNDK | $38.28 | $49.33 | 28.9% | $69.89 | 16.9% |
| SOLR | $10.65 | $11.17 | 4.9% | $76.44 | 6.9% |
| SUPG | $2.85 | $2.71 | -4.9% | $76.70 | 6.5% |
| UNTD | $5.90 | $6.60 | 16.9% | $63.53 | 28.6% |
| Grand Total | 3.4% | 13.3% |
So you can see my current stocks are trailing the index by about ten points. My broader metrics, which include my tracking portfolios, mechanical portfolios and Magic Diligence show that open MFI portfolios are generally trailing by 3 to 5 points. So I am clearly under-performing.
If you remove my six RTO stocks, guess what? I am doing great! I am up 15.3% versus 12.5% for the index. Well, sadly they are in my portfolio and it isn't like I went in not understanding their risks.
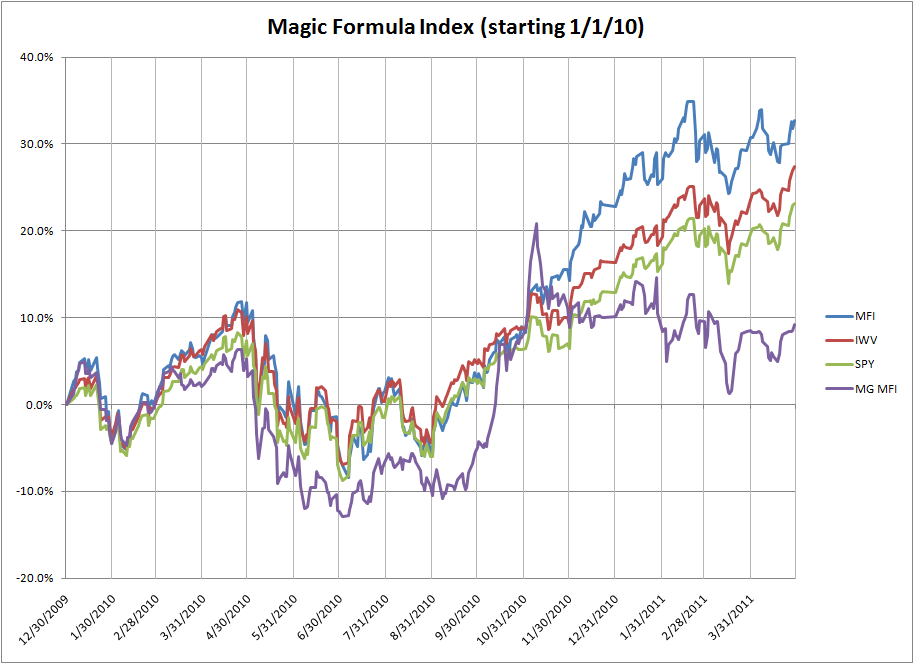
Graph Since January 2010
Here is a graph showing my performance since January 2010. This graph is interesting as it shows day-to-day performance of my portfolio vs the MFI index and the Russell 3000.


No comments:
Post a Comment